'/%3e%3cpath%20fill='%2305070d'%20d='M32%2044.5c-.9-.6-14-8.6-14-17%200-4.1%203.1-7.3%207-7.3%202.9%200%205.4%201.7%207%204.3%201.6-2.6%204.1-4.3%207-4.3%203.9%200%207%203.2%207%207.3%200%208.4-13.1%2016.4-14%2017z'/%3e%3c/svg%3e)
Dashboard
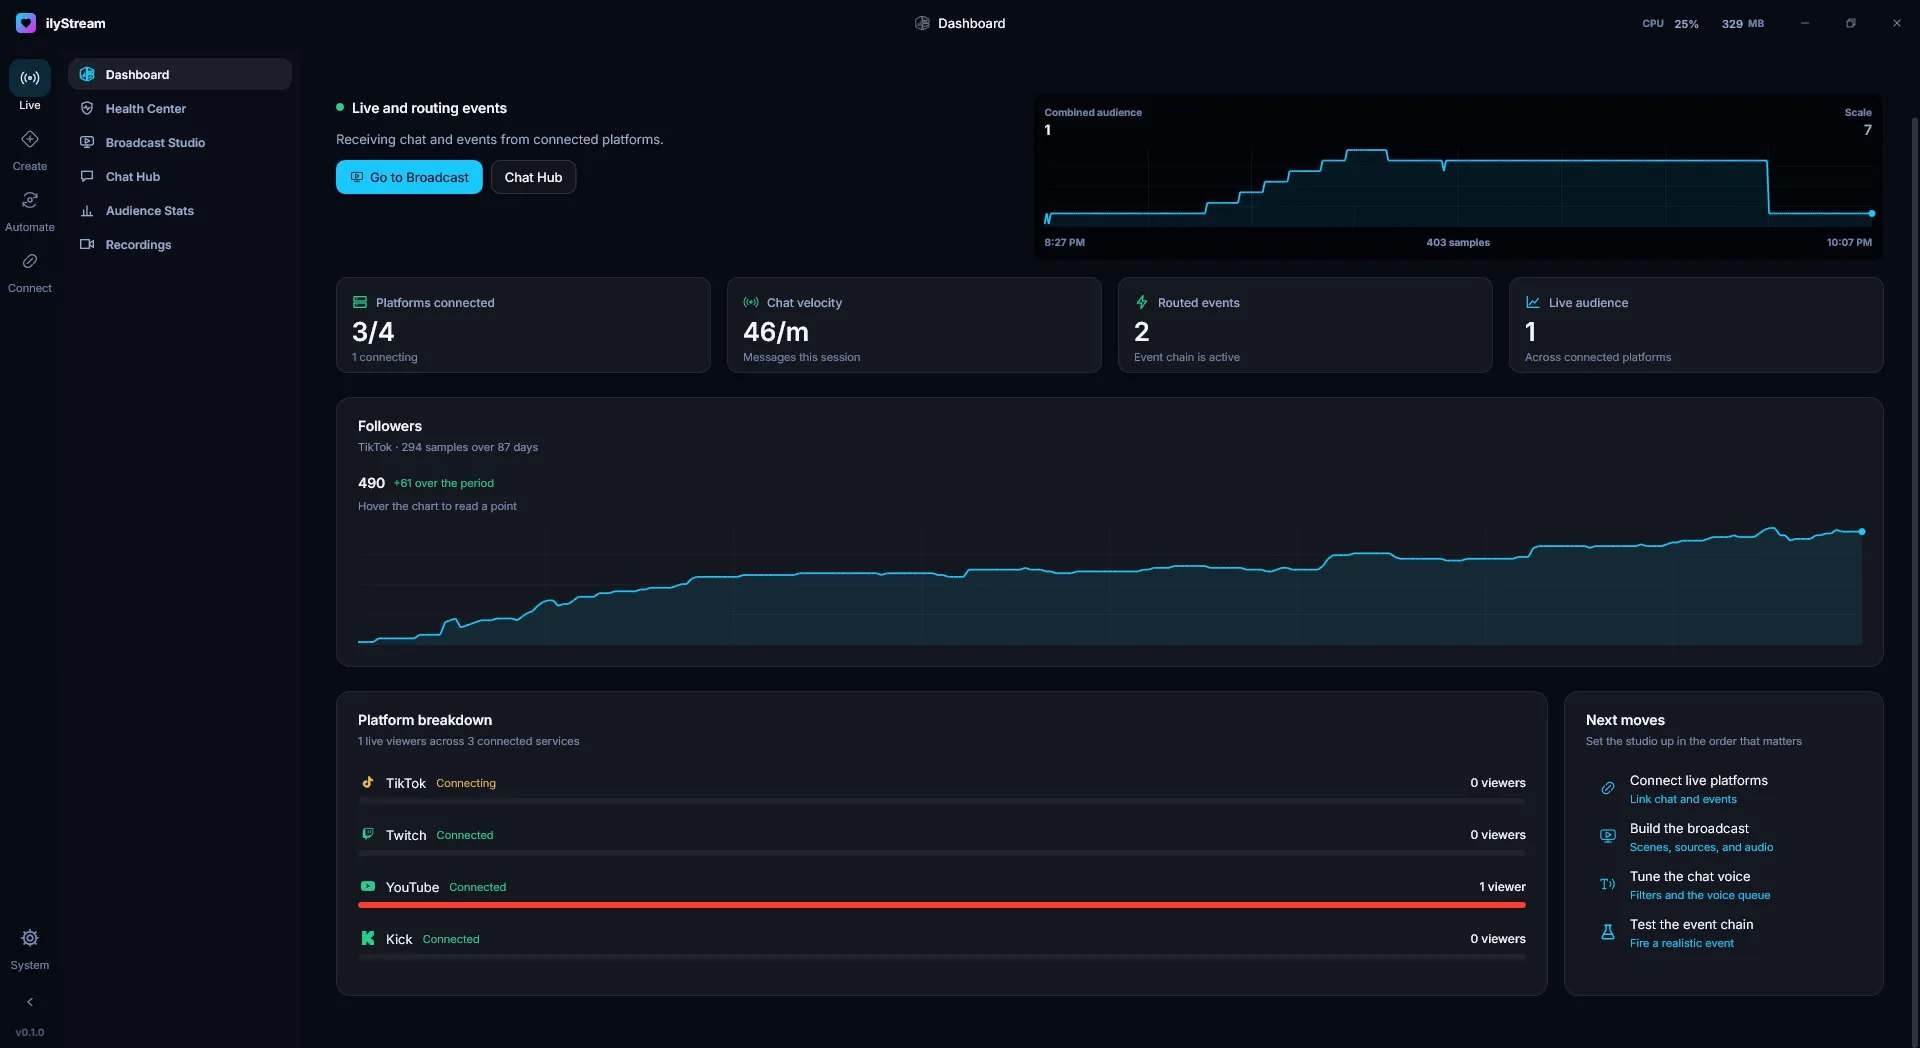
Live → Dashboard shows what is live, what needs attention, and where to act next.
Live and routing events
Section titled “Live and routing events”The banner at the top tells you whether ilyStream is receiving chat and events from your connected platforms. It links straight to Broadcast Studio and Chat Hub.
Combined audience
Section titled “Combined audience”The chart next to the banner plots your combined audience across every connected platform over the session, with the current value and the chart’s scale in the corners.
Summary cards
Section titled “Summary cards”| Card | What it shows |
|---|---|
| Platforms connected | How many of your platforms are connected, and how many are still connecting. |
| Chat velocity | Messages per minute this session. |
| Routed events | How many events have gone through your event chain, and whether it’s active. |
| Live audience | Viewers across your connected platforms right now. |
Followers
Section titled “Followers”A chart of your follower count over time, with the change over the period. Hover the chart to read any point.
Platform breakdown
Section titled “Platform breakdown”Each connected platform with its connection status — Connected or Connecting — and its current viewers.
Next moves
Section titled “Next moves”A short checklist for setting up the studio in the order that matters. Set up your first stream walks through it step by step.
© 2026 ilyStream